This represents work from several people at the NAO. Thanks especially to Dan Rice for implementing the duplicate junction detection, and to Will Bradshaw and Mike McLaren for editorial feedback.
Summary
If someone were to intentionally cause a stealth pandemic today, one of the ways they might do it is by modifying an existing virus. Over the past few months we’ve been working on building a computational pipeline that could flag evidence of this kind of genetic engineering, and we now have an initial pipeline working end to end. When given 35B read pairs of wastewater sequencing data it raises 14 alerts for manual review, 13 of which are quickly dismissible false positives and one is a known genetically engineered sequence derived from HIV. While it’s hard to get a good estimate before actually going and doing it, our best guess is that if this system were deployed at the scale of approximately $1.5M/y it could detect something genetically engineered that shed like SARS-CoV-2 before 0.2% of people in the monitored sewersheds had been infected.
System Design
The core of the system is based on two observations:
If someone has made substantial modifications to an existing virus then somewhere in the engineered genome there will be a series of bases that are a good match for the original genome followed by a series of bases that are a poor match for the original genome. We can look for sequencing reads that have this property and raise them for human review.
Chimeric reads can occur as an artifact of sequencing, which can lead to false positives. The chance that you would see multiple chimeras involving exactly the same junction by chance, however, is relatively low. By requiring 2x coverage of the junction we can remove almost all false positives, at the cost of requiring approximately twice as much sequencing.
Translating these observations into sufficiently performant code that does not trigger alerts on common sequencing artifacts has taken some work, but we now have this running.
While it would be valuable to release our detector so that others can evaluate it or apply it to their own sequencing reads, knowing the details of how we have applied this algorithm could allow someone to engineer sequences that it would not be able to detect. While we would like to build a detection system that can’t be more readily bypassed once you know how it works, we’re unfortunately not there yet.
Evaluation
We have evaluated the system in two ways: by measuring its performance on simulated genetic engineered genomes and by applying it to a real-world dataset collected by a partner lab.
Simulation
We chose a selection of 35 viruses that Virus Host DB categorizes as human-infecting viruses, with special attention to respiratory viruses:
| Disease | Virus | Genome Length |
|---|---|---|
| AIDS | HIV | 9,000 |
| Chickenpox and Shingles | Human alphaherpesvirus 3 | 100,000 |
| Chikungunya | Chikungunya virus | 10,000 |
| Common cold | Human coronavirus 229E | 30,000 |
| Common cold | Human coronavirus NL63 | 30,000 |
| Common cold | Human coronavirus OC43 | 30,000 |
| Common cold | Human rhinovirus NAT001 | 7,000 |
| Common cold | Rhinovirus A1 | 7,000 |
| Common cold | Rhinovirus B3 | 7,000 |
| Conjunctivitis | Human adenovirus 54 | 30,000 |
| COVID-19 | SARS-CoV-2 | 30,000 |
| Ebola | Ebola | 20,000 |
| Gastroenteritis | Astrovirus MLB1 | 6,000 |
| Influenza | Influenza A Virus, H1N1 | 10,000 |
| Influenza | Influenza A Virus, H2N2 | 10,000 |
| Influenza | Influenza A Virus, H3N2 | 10,000 |
| Influenza | Influenza A Virus, H7N9 | 10,000 |
| Influenza | Influenza A Virus, H9N2 | 10,000 |
| Influenza | Influenza C Virus | 10,000 |
| Measles | Measles morbillivirus | 20,000 |
| MERS | MERS Virus | 30,000 |
| Metapneumovirus infection | Human metapneumovirus | 10,000 |
| Mononucleosis | Human herpesvirus 4 type 2 | 200,000 |
| MPox | Monkeypox virus | 200,000 |
| Mumps | Mumps orthorubulavirus | 20,000 |
| Nipah | Henipavirus nipahense | 20,000 |
| Parainfluenza | Human orthorubulavirus 2 | 20,000 |
| Parainfluenza | Human parainfluenza virus 4a | 20,000 |
| Parainfluenza | Human respirovirus 1 | 20,000 |
| Parainfluenza | Human respirovirus 3 | 20,000 |
| Parainfluenza | Parainfluenza virus 5 | 20,000 |
| Respiratory illness, conjunctivitis | Human adenovirus 1 | 40,000 |
| Respiratory illness, gastroenteritis | Human adenovirus 5 | 40,000 |
| RSV infection | RSV | 20,000 |
| Rubella (German measles) | Rubella virus | 10,000 |
For each virus we generated 1,000 simulated engineered genomes by inserting a random string of 500 bases at a random location within its genome. Then we ran InSilicoSeq 2.0.1 to generate 100,000 read pairs for each virus. We configured InSilicoSeq to use a sequencing error model approximating a NovaSeq, and to generate reads from fragments with a mean length of 187 and a standard deviation of 50. We also generated a set of control sequences, using the same process but without inserting any bases.
After running the pipeline on these 7,000,000 read pairs (100,000 per virus × 35 viruses × treatment vs control) we checked what fraction of reads were flagged as containing a suspicious junction. While normally we filter the output of the pipeline to only junctions that appear multiple times, we didn’t do that for these tests. The issue is that while with a real genetically engineered virus you would expect to see the same junction consistently each time you happened to sequence that portion of its genome, in our tests here we didn’t insert into a single consistent location.
The pipeline flagged 1.2% of simulated engineered reads and 0.003% of control reads. How does 1.2% compare to what the pipeline should be able to do? We made a simple baseline model, where sequencing reads are uniformly distributed along the genome, there are no read errors, and a junction can only be flagged if it is at least 30 bases from the end of a sequencing read. Of the sequencing reads that the baseline model classifies as flaggable, the pipeline flagged 71%. We haven’t yet looked into why this is lower than predicted, and aren’t sure whether it’s the model being overly optimistic or the pipeline missing cases it ought to be able to identify.
This chart shows, for each virus, the fraction of sequencing reads flagged as containing a suspicious junction and the pipeline performance relative to the simple model:
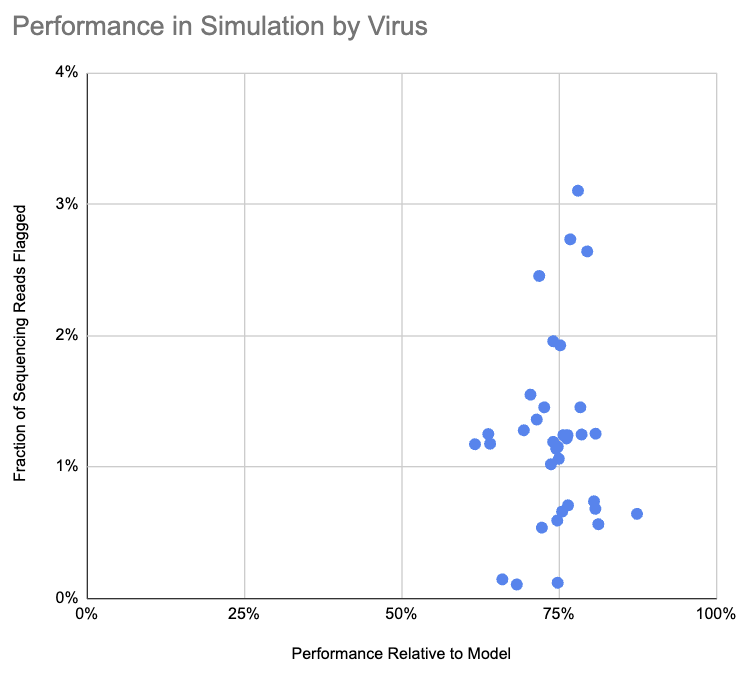
Note that we don’t label the viruses on this chart, because that could be useful to someone in selecting a virus for the kind of attack we are attempting to detect.
Real World Evaluation
We partnered with Marc Johnson and Clayton Rushford at the University of Missouri (MU) to sequence municipal wastewater, primarily RNA, and collected 35 billion paired-end sequences across four runs. The sequencing was performed at the University of Missouri Genomics Technology Core on a NovaSeq 6000 with an S4 flow cell, and covered samples collected between December 2023 and April 2024.
Applying the pipeline to these 35 billion read pairs it flags fourteen collections of reads for manual evaluation. Of these:
Eight are chimeras between common gastrointestinal viruses and bacterial ribosomal RNA. While you might expect that requiring the same junction to be seen multiple times would filter these out, this is a common enough pattern that we occasionally see repeats. In seven of eight cases there are several bases of overlap, where the end of the viral sequence shares bases with the beginning of the rRNA sequence. Average overlap across the seven cases is six bases, with a minimum of four and a maximum of nine.
Five are flagged because the databases we use for removing false positives are not complete. While we have ideas for how to efficiently screen against very large databases, we currently need to make some compromises for efficiency.
One is an engineered lentiviral vector, most likely pHR’-CMVLacZ. This, and related vectors, use molecular machinery derived from HIV to insert genes into target genomes. While this is a benign example of an engineered sequence derived from a human-infecting virus, the pipeline doesn’t know this and is correct to flag it.
It’s possible to tune the pipeline to be more or less sensitive by requiring a different coverage level. If we turn up the sensitivity by flagging things for manual review on the first observation, it flags 12k suspicious junctions, far too many for manual review. If instead we turn down the sensitivity and require three observations it no longer flags any chimeras between gastrointestinal viruses and ribosomal RNA, and only flags the lentiviral vector and three sequences missing from the databases we use to screen out false positives.
We also partnered with Jason Rothman in Katrine Whiteson’s lab at the University of California, Irvine (UCI), in an additional municipal wastewater RNA sequencing effort. From the 25 billion paired-end sequences we’ve analyzed from this group the pipeline flags 64 collections of reads for evaluation. While this is slightly too many for manual evaluation, in spot checking a large fraction are a kind of artifact called “strand-split artifact reads”. These are sequencing reads which switch strand and direction partway through the read. These should be possible to automatically identify and exclude, but this is work we still need to do.
System Sensitivity
We’ve previously estimated that, in a week where 1% of people in a sewershed have contracted Covid-19, with the sequencing and sampling approach in Rothman et al. (2021) one in 7.7M municipal wastewater RNA sequencing reads would be from the SARS-CoV-2 genome, a relative abundance of 1.3e-7.
As noted above, the pipeline flags only an average of 1.2% of simulated engineered reads, primarily because most reads from an engineered pathogen won’t happen to include both the original virus and the modified section. This means that the relative abundance of flaggable reads would be 1.6e-9 if we estimate from SARS-CoV-2.
The most cost-effective sequencer right now, in terms of cost per base, is the Illumina NovaSeq X. It can produce approximately 10B read pairs with a $9,600 flow cell or 25B with a $16,000 flow cell. The flow cell is usually around 3/4 of the total cost, so we estimate $13,000 for 10B and $22,000 for 25B. The sequencer runs for just over a day, and you lose some time to sequencing preparation on the beginning and bioinformatics on the end, so we’ll estimate five days end to end time.
If you were to run a NovaSeq X 25B once a week (approximately $1.5M/y) and needed to see a junction in two different samples before alerting, how many people in your catchment would be sick before the system raised an alert? Running our simulator (blog post, simulator data) we can get some estimates:
| Scenario | Cumulative Incidence at Detection | |||
|---|---|---|---|---|
| 25th | 50th | 75th | 90th | |
| Sars-CoV-2 Weekly 25B | 0.1% | 0.2% | 0.3% | 0.5% |
With a hypothetical genetically engineered virus that shed similarly to SARS-CoV-2, in the median case the simulator predicts 0.2% of people would have been infected before an alert were raised. Note that we’ve seen speculation that SARS-CoV-2 is unusually well-suited for wastewater-based detection as respiratory pathogens go, and until we have estimates for additional pathogens we’d recommend taking this with a grain of salt.
We also generated estimates for the cheaper but lower output 10B flow cell:
| Scenario | Cumulative Incidence at Detection | |||
|---|---|---|---|---|
| 25th | 50th | 75th | 90th | |
| Sars-CoV-2 Weekly 10B | 0.2% | 0.4% | 0.8% | 1.2% |
The limit of detection is a bit over twice as high, but the cost only decreases by 40%, so the deeper sequencing option is better if there is sufficient funding available.
Future Work
We see this as a minimum-viable system for detecting genetically engineered pathogens, but there are multiple places we are eager to expand and improve it:
The current system has some “holes” in its implementation that keep us from releasing the code publicly. This limits our ability to share it, both for critical evaluation and for external deployment. Most of these holes are avoidable, however, and with some work we think we can get this to a place where we can open source it.
The current algorithm is specific to viruses, but bacterial threats are also concerning. Because recombination is much more common with bacteria than viruses, we suspect we’ll need substantial additional development and tuning to get good results with bacterial pathogens.
This detection algorithm is one of many potential ways to detect novel pathogens, and we would like to put significant effort into developing additional ones. That process is limited in part by the available data, and running this system at a larger scale will give us exactly the sort of data we need.
In our testing the pipeline was on average only 71% as effective as the model predicted. We need to resolve this discrepancy, and to the extent it turns out to be issues with the pipeline instead of the model being too simple we may be able to moderately increase our detection sensitivity.
Our sensitivity estimates are based only on SARS-CoV-2, but it would be better to have estimates based on a range of human-infecting viruses. In late Q3 we’re planning to put out a blog post combining the methods from our relative abundance preprint with the new sequencing data described above, which should let us estimate from Influenza A as well.
While we’ve validated this computationally and with a likely lab contaminant, we would also like to run experiments where we “spike” samples with genetically modified viruses before sequencing them and running them through the pipeline.
The pipeline is tuned for Illumina data, where each base is called with high confidence. We would like to tune it to work on Nanopore data, which has a much higher error rate. This will become increasingly important as we scale up our pooled individual sequencing efforts.